What is behind the recent (2018-2021) divergence in market performance between high and low beta stocks?
Last updated: January 17, 2022
March 23, 2020 marked the low point for the S&P 500 index during the brief 2020 recession. The U.S. stock market rebounded sharply following the lows of March 2020 and continued its rise in 2021. But not all stocks participated equally in the market rally. One factor that accounted for some of the variation in returns is the beta value. Beta measures a stock’s market risk exposure. This visualization examines the relationship between beta and returns. It shows monthly returns during the 2018-2021 period for the S&P 500 index, a portfolio of high beta stocks, and a portfolio of low beta stocks. The high (low) beta portfolio is comprised of 75 S&P 500 index stocks that have consistently maintained beta values above (below) 1 since the start of 2018. The stocks that comprise the high and low beta portfolios are listed below.
The visualization shows that the high beta portfolio outperformed the low beta portfolio by a factor of more than 3.5 over the 2018-2021 period. During this period, the low beta portfolio gained 62%, the high beta portfolio gained 221%, and the S&P 500 index gained 78%.
Beta is a financial measure of a stock’s systematic risk, which is market risk exposure that cannot be mitigated through diversification. The capital asset pricing model (CAPM) uses beta to model the relationship between systematic risk and expected return. Analysts estimate a stock’s beta value using regression analysis, where a stock’s return is the dependent variable, and the market portfolio return (typically the S&P 500 Index) is the explanatory variable. The estimate for a stock’s beta value is given by:
$$ \beta_i = \frac {Cov(r_i, r_m)} {Var(r_m)} $$
where $ \beta_i $ is the beta value for asset $ i $, $ r_i $ is the return of asset $ i $, and $ r_m $ is the return of the market portfolio. The beta values depicted in the visualization were estimated using daily returns in a 12 month period. The estimates use the S&P 500 Index as the proxy for the market portfolio.
The bottom chart depicts the cumulative returns since the start of 2018 for the S&P 500 index and the two portfolios. The returns are market capitalization-weighted. The top chart shows a dynamic scatter plot with bubbles representing the monthly returns and beta values for each stock. The bubbles are color-coded to indicate whether the stock is part of the high or low beta portfolio. The bubbles represent values as of the month shown to the right of the top chart (the “current month”). The size of each bubble is proportional to the stock’s market capitalization. The bubble’s opacity is proportional to the stock’s daily return volatility. The three vertical lines indicate the monthly returns for the high and low beta portfolios and the S&P 500 index. The x-axis shows the monthly return, and the y-axis shows the beta value. The beta values are estimated over the 12 month period prior to the current month.
Returns
The visualization shows that the S&P 500 index had a positive return during 71% (34 out of 48) of the months in the 2018-2021 period. During the 34 months when the S&P 500 index had positive returns, the average monthly returns of the S&P 500 index and the high and low beta portfolios were 3.8%, 5.5%, and 2.6%. During the 14 months when the S&P 500 index had negative returns, the average monthly returns of the S&P 500 index and the high and low beta portfolios were -4.7%, -4.2%, and -2.5%. Note that the high beta portfolio outperformed the S&P 500 index even during the months when the index had negative returns. Both the high and low beta portfolios outperformed the S&P 500 index in March 2020. In that month, the S&P 500 index lost 12.5%, the high beta portfolio lost 11.4%, and the low beta portfolio lost 4.9%.
Market Capitalization
The visualization also shows significant variation in firm size (as measured by market capitalization) within each of the portfolios. Note that the low beta and high beta portfolios had similar average market capitalizations at the start of 2018, but by the end of 2021, the average market capitalization for the high beta portfolio was twice as large as that of the low beta portfolio.
Beta
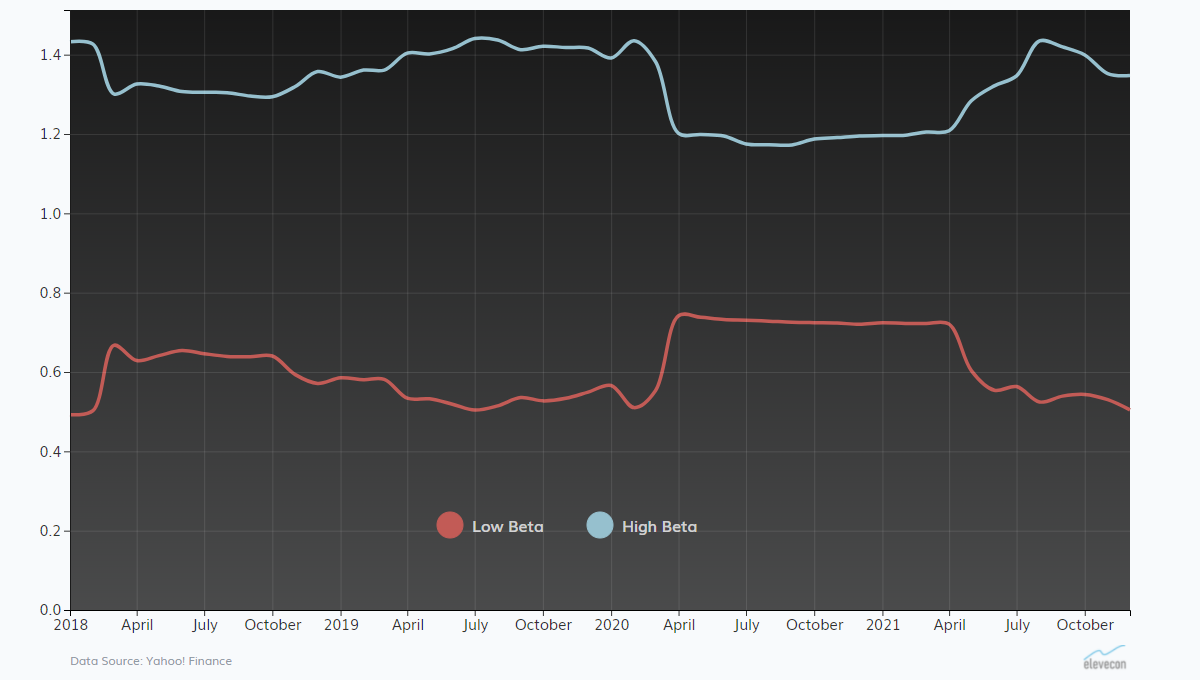
The graph below shows the average beta values for the high and low beta portfolios over the 2018-2021 period. It shows a narrowing of the average beta values between the high and low portfolios around the volatile months of March and April 2020. For the estimation periods that include either March or April 2020, the average beta values are 1.19 for the high beta portfolio and 0.73 for the low beta portfolio. For all other periods, the average beta values are 1.37 for the high beta portfolio and 0.57 for the low beta portfolio. The higher returns for high beta stocks during a rising stock market are consistent with the CAPM as higher market risk implies higher expected returns when the overall stock market generates positive returns. However, previous economic studies have found little empirical support for the CAPM’s prediction about the relationship between beta and returns. Moreover, the observed differences in market performance between high and low beta stocks during the 2018-2021 period cannot be easily explained based on the estimated beta values for the two portfolios.
Beta: High Beta vs. Low Beta Portfolios
(2018 - 2021)

Volatility
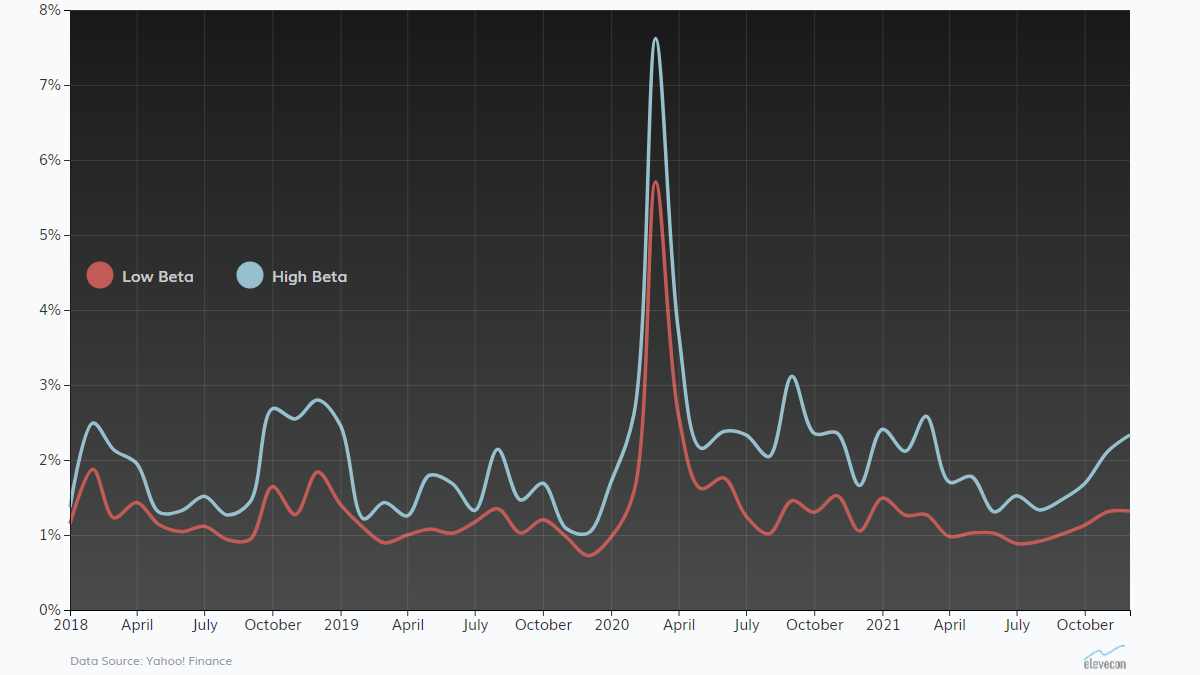
The visualization shows a high level of volatility during the months of March and April 2020. The graph below shows the average monthly volatilities for the high and low beta portfolios over the 2018-2021 period. It shows that high beta stocks had higher average volatilities than low beta stocks, consistent with greater market risk exposure for high beta stocks.
Volatility: High Beta vs. Low Beta Portfolios
(2018 - 2021)

Will high beta stocks continue to outperform low beta stocks?
The divergence in market performance between high and low beta stocks during the 2018-2021 period cannot continue indefinitely. When will low beta stocks begin to outperform high beta stocks? Is the trend reversal years away or has it already started? Note that in December 2021, the low beta portfolio gained 8.8%, the high beta portfolio gained 2.1%, and the S&P 500 index gained 4.4%. But market performance in a single month does not demonstrate any change in trend. The high beta portfolio includes a number of recent super-performers, such as Tesla, Nvidia, and Apple, which gained 1,597%, 514%, and 339% over the 2018-2021 period. Can these stocks continue this level of market performance? The 2022 stock market may provide answers to these questions.
High Beta Portfolio Stocks
| Adobe | Align Technology | AMD | American Airlines Group | American Express |
| Ameriprise Financial | Analog Devices | Ansys | APA Corporation | Apple |
| Applied Materials | Aptiv | Arista | Autodesk | BlackRock |
| Broadcom | Cadence Design Systems | Caesars Entertainment | Capital One | Corning |
| Devon Energy | Diamondback Energy | Discover Financial Services | DuPont | Fortinet |
| Freeport-McMoRan | Global Payments | Hess Corporation | Howmet Aerospace | HP |
| Intel | Invesco | KLA Corporation | Lam Research | Lincoln National |
| LyondellBasell | Marathon Oil | Mastercard | MetLife | MGM Resorts International |
| Microchip Technology | Micron Technology | Microsoft | Monolithic Power Systems | Morgan Stanley |
| NetApp | Nucor | Nvidia | Parker-Hannifin | Paycom |
| PayPal | Penn National Gaming | Principal Financial Group | Prudential Financial | Qorvo |
| Qualcomm | Raymond James Financial | Royal Caribbean Group | Salesforce | ServiceNow |
| Skyworks Solutions | State Street Corporation | SVB Financial | T. Rowe Price | TE Connectivity |
| Teradyne | Tesla | Texas Instruments | The Mosaic Company | Trimble |
| United Rentals | Visa | Western Digital | Xilinx | Zebra Technologies |
Low Beta Portfolio Stocks
| Alliant Energy | Altria | Ameren | American Electric Power | American Water |
| Aon | Arthur J. Gallagher & Co. | AT&T | Atmos Energy | AutoZone |
| Bristol Myers Squibb | Brown & Brown | Brown–Forman | C. H. Robinson | Campbell Soup |
| Cboe Global Markets | Cerner | Church & Dwight | Clorox | CMS Energy |
| Coca-Cola | Colgate-Palmolive | Con Edison | Conagra Brands | Costco |
| Crown Castle | Digital Realty | Domino's Pizza | Duke Energy | Eli Lilly |
| Equinix | Eversource Energy | Extra Space Storage | General Mills | Hormel |
| Intercontinental Exchange | Iron Mountain | Jack Henry & Associates | JM Smucker | Johnson & Johnson |
| Kellogg's | Kimberly-Clark | Kraft Heinz | L3Harris Technologies | Lockheed Martin |
| Marsh & McLennan | McCormick & Company | McDonald's | Merck | Molson Coors |
| Mondelez International | Newmont | NextEra Energy | Northrop Grumman | PepsiCo |
| Pfizer | Philip Morris International | Procter & Gamble | Progressive Corporation | PSEG |
| Public Storage | Quest Diagnostics | Republic Services | SBA Communications | Target |
| The Hershey Company | Tyson Foods | Verizon Communications | Walmart | Waste Management |
| WEC Energy Group | West Pharmaceutical Services | Willis Towers Watson | Xcel Energy | Yum! Brands |
